 Marketing Team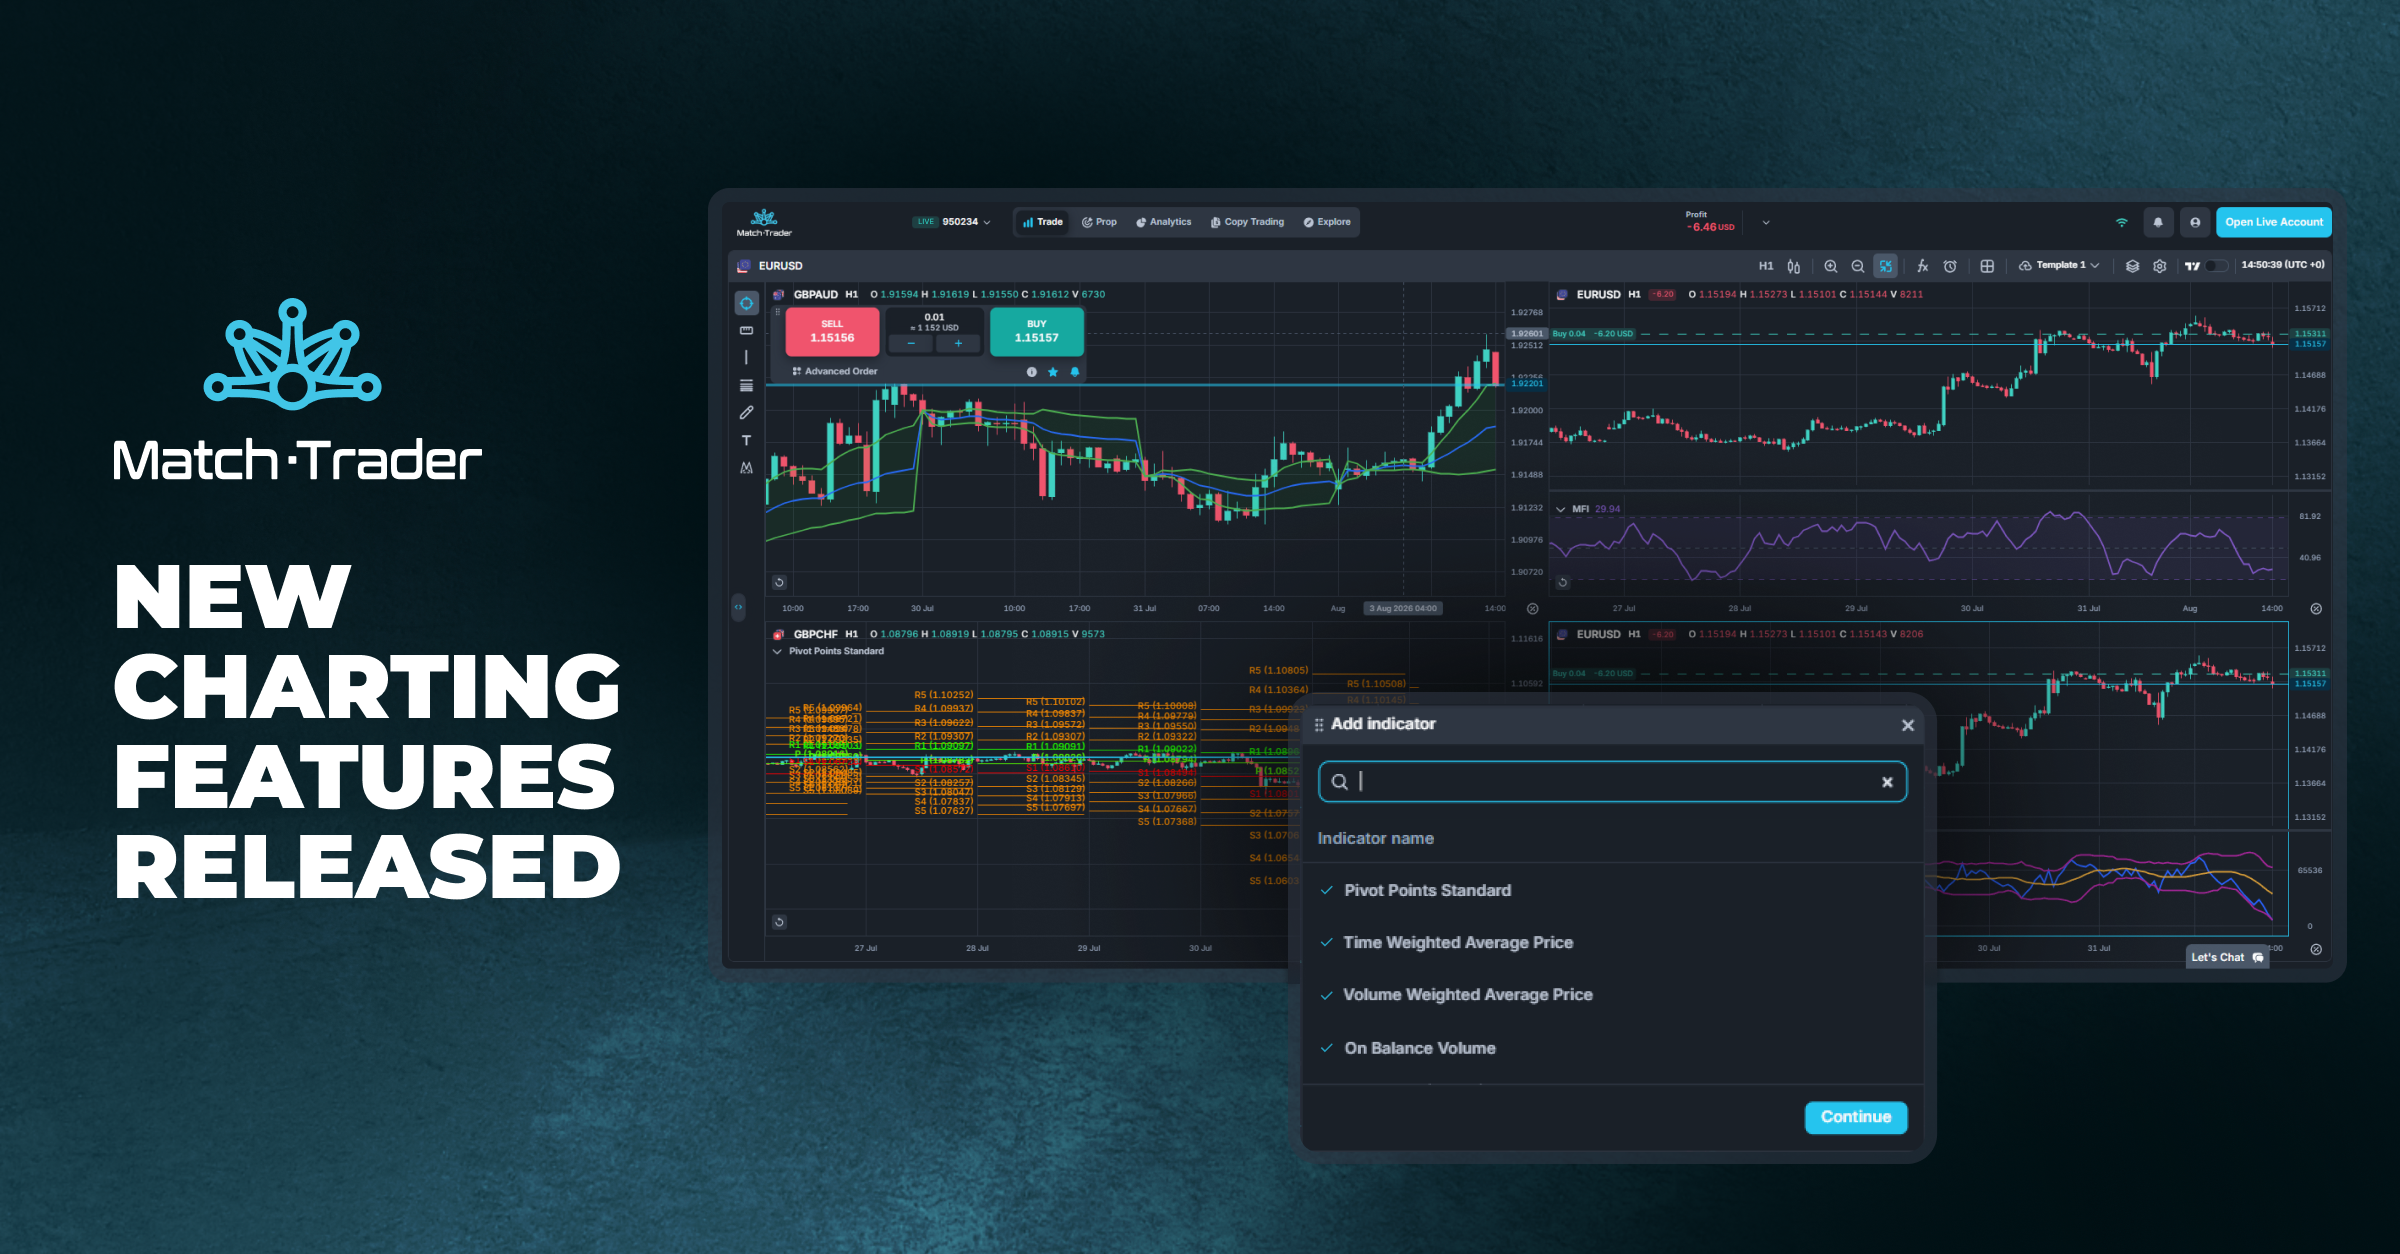
Match-Trade Technologies has introduced a major expansion of the Match-Trader indicator library, bringing the platform’s built-in charting toolkit to a new level. With 63 additional indicators now available directly on Match-Trader, traders gain broader support for advanced technical workflows without having to move away from execution. The update includes 49 technical indicators for core chart analysis, along with 14 volume-based indicators. Together, they give traders more flexibility to create consistent, repeatable methods within the platform’s charting environment.
Expanded Indicator Library: Benefits for Brokers and Traders
The upgraded library provides a broader set of tools for analyzing trends, momentum, volatility, market regimes, and price structure. With more indicators available natively, traders can combine complementary signals more effectively, validate setups with greater confidence, and replicate multi-indicator strategies directly in Match-Trader charts. The wider native indicator selection also strengthens the platform’s competitive position for brokers and helps address one of the key reasons experienced clients often keep external charting platforms open.
The update also enhances activity-based analysis with the inclusion of 14 volume-based indicators. Because Forex and CFD markets typically lack centralized exchange volume, these indicators use tick volume as a practical proxy for market activity. This helps traders confirm or challenge price moves by assessing whether breakouts, reversals, and trend-continuation setups are likely to be supported by stronger market interest.
The new indicators are fully integrated into the charting workflow, allowing traders to add them to any chart, adjust the settings as needed, and save preferred setups through Indicator Templates.
Key Indicators and Use Cases
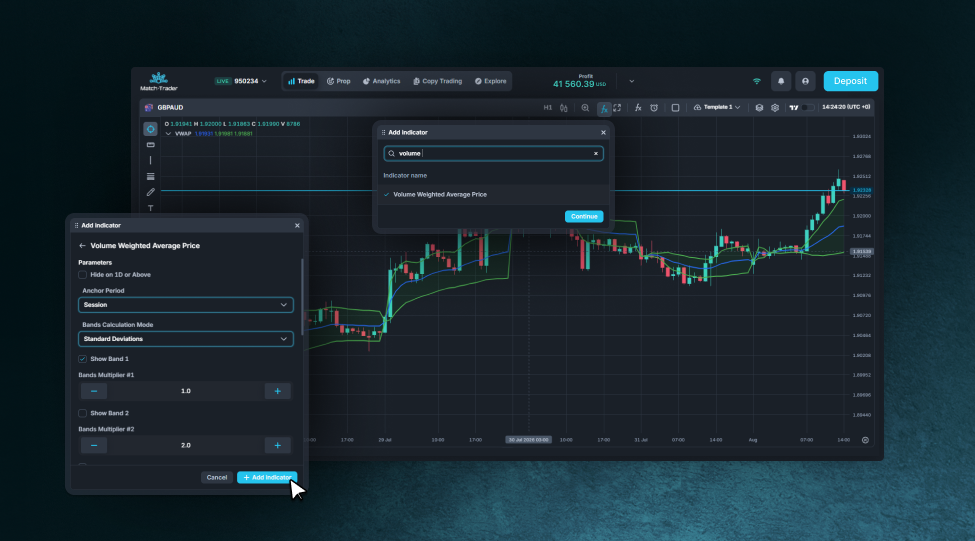
Volume Weighted Average Price
VWAP is a volume-weighted average price indicator that gives traders a view of the market’s intraday value by combining price and activity. Commonly used in day trading, particularly across equities and crypto markets, it is also closely associated with institutional trading funds and algorithms. VWAP allows traders to quickly assess intraday direction, measure the strength of price moves, and identify changes in participation without switching the platform or relying on external charting tools.
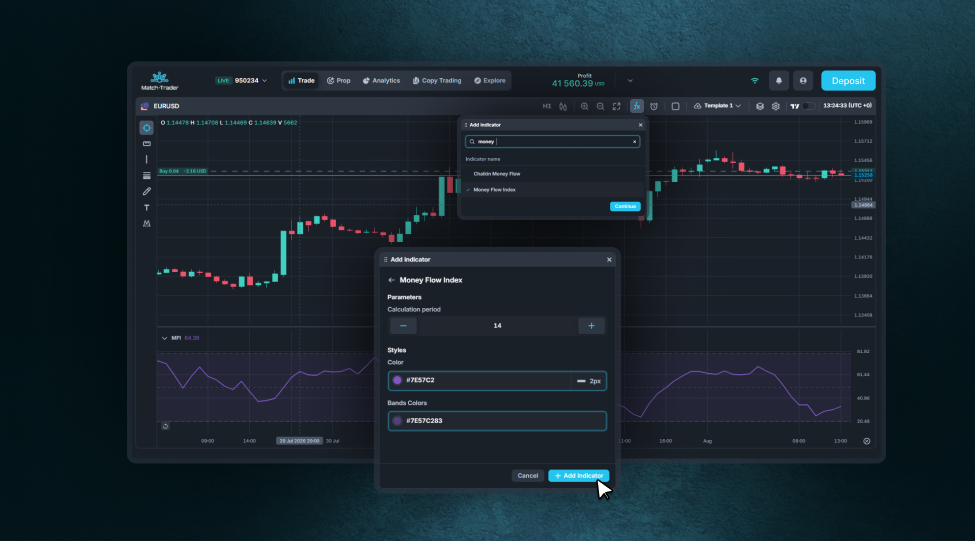
Money Flow Index
Money Flow Index, or MFI, measures buying and selling pressure by combining price action with volume data as a volume-aware momentum oscillator. It is displayed as a line within a 0–100 range, where a rising MFI typically indicates growing buying pressure, while a falling MFI points to increasing selling pressure.
Often viewed as a “volume-based RSI,” MFI is intuitive for RSI users to adopt. It is commonly used to spot overbought and oversold conditions, identify divergences, and track failure swings, helping traders either confirm price action or question moves that appear weakly supported.
Pivot Points
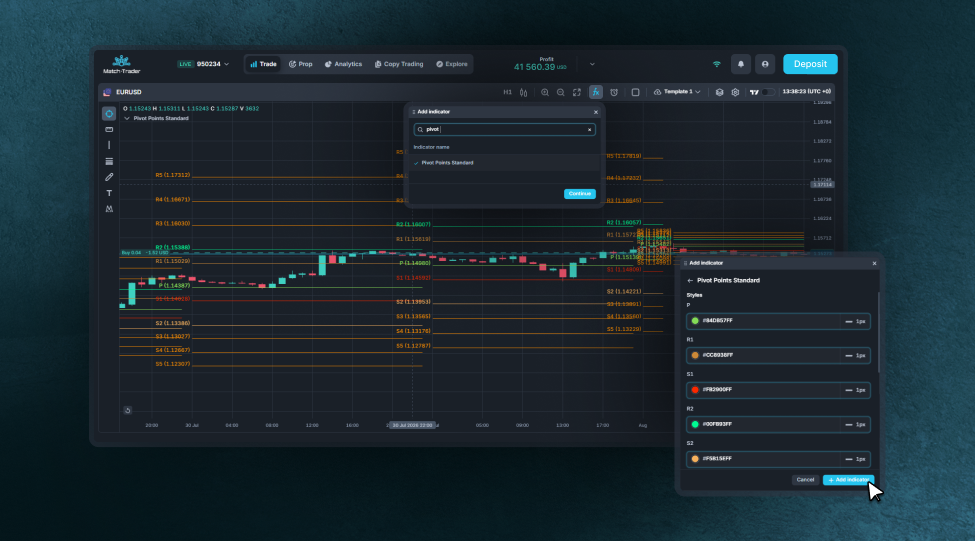
Pivot Points Standard automatically identifies key price levels where the market may encounter support or resistance, centered around a main pivot level. Rather than drawing levels manually each session, traders receive a ready-made map of potential reaction areas.
Because of their speed and ease of use, Pivot Points remain a popular tool for intraday analysis. With the updated indicator library, they can be added and configured on any chart to support more detailed analysis.
On Balance Volume
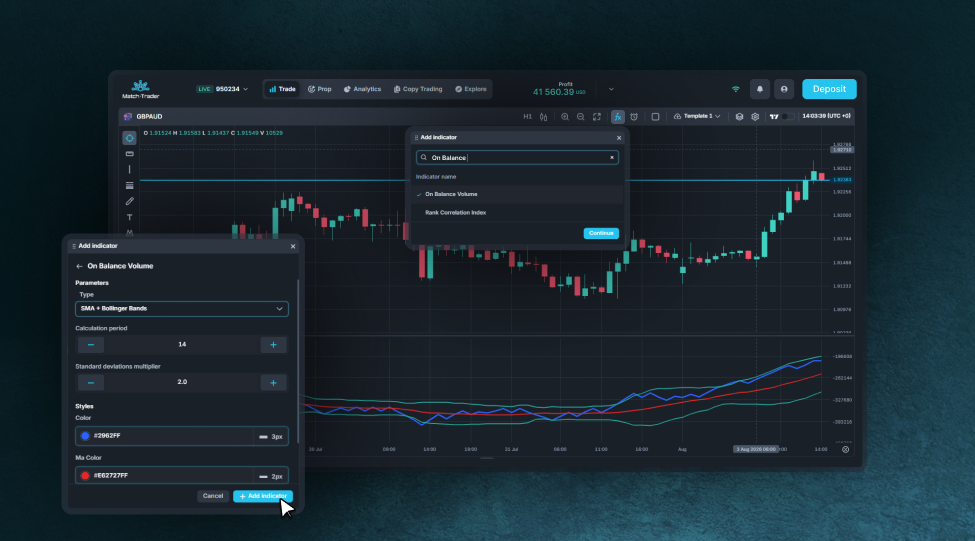
OBV is a classic volume-based indicator that links price movement with activity to monitor buying versus selling pressure over time. It is calculated on a cumulative basis – volume is added when the price closes higher and subtracted when it closes lower. By following the OBV line, traders can see whether market participation is increasing or beginning to fade behind a move. This makes OBV useful for confirming price trends and identifying divergences, which is why it is often included in straightforward, beginner-friendly trading approaches.
The Value Behind the Indicator Expansion
With 63 new indicators added to Match-Trader, this release is intended to make advanced chart analysis easier to manage within the platform, enabling traders to build, validate, and reuse strategies without disrupting execution.
“A richer native indicator library is one of the fastest ways to enhance the day‑to‑day trading experience,” said Serhii Poplavskyi, Head of Match-Trader Platform. “Our expansion brings more of the charting toolkit traders expect into Match‑Trader itself, helping brokers keep core workflows inside the platform.”